
Introducing the Corvic Agentic Ontology Graph Specification: An Open, Pragmatic, AI-First Approach
By Corvic AI
What is the Corvic Agentic Ontology Graph?
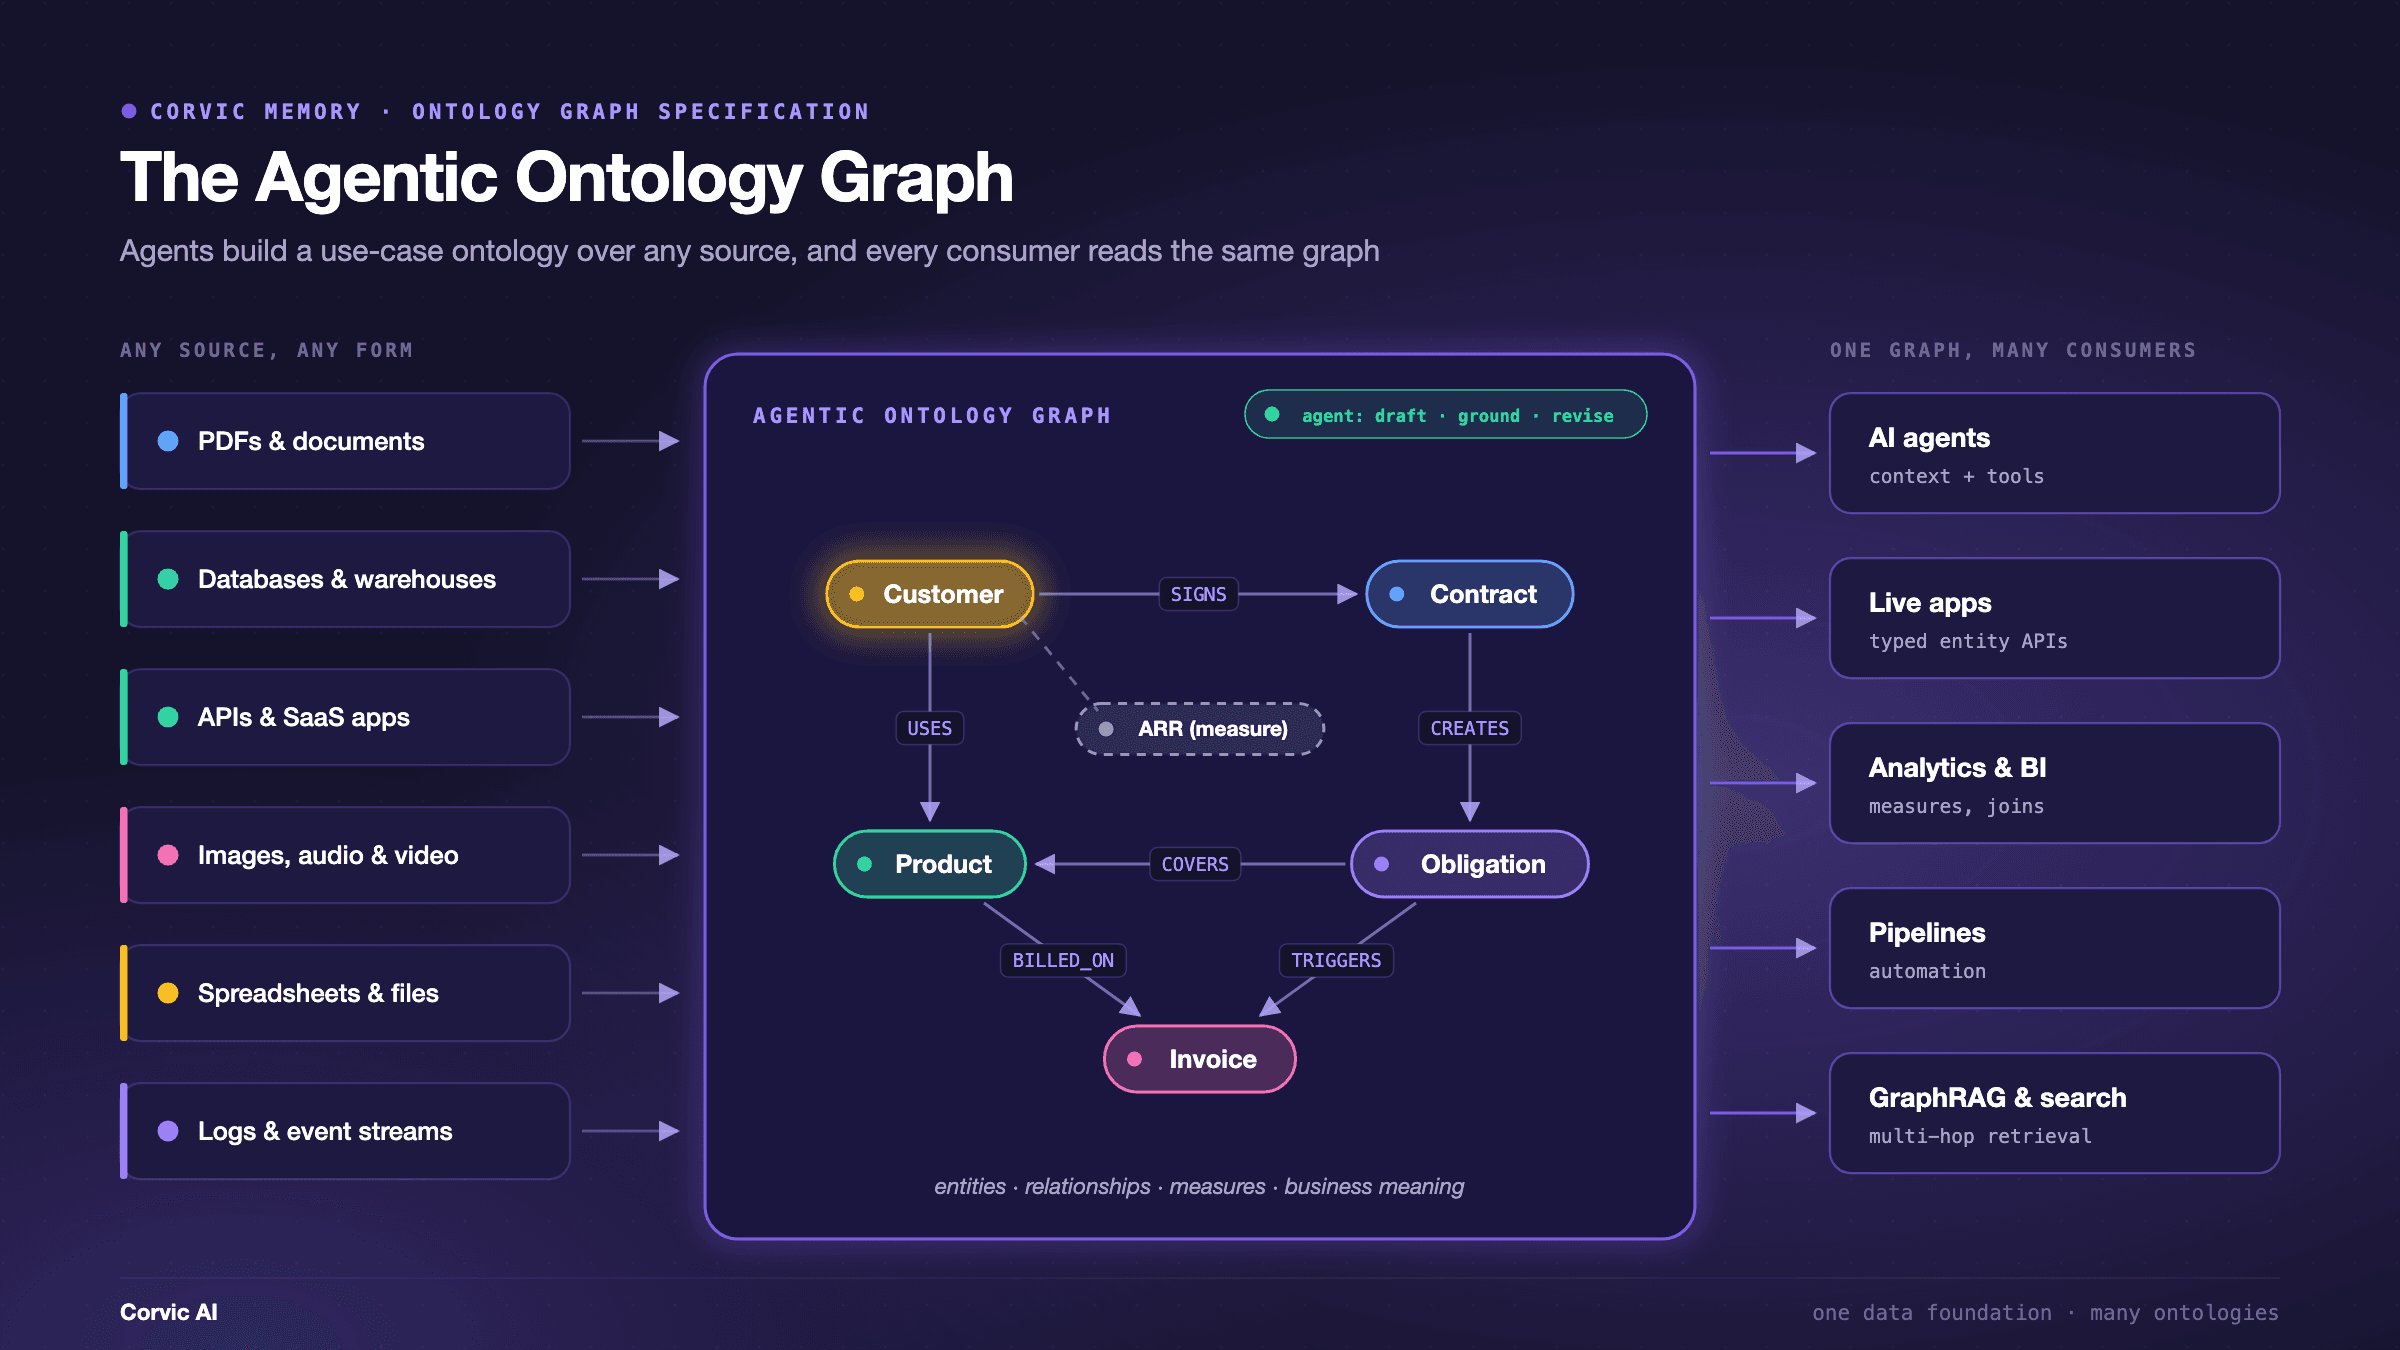
The Corvic Agentic Ontology Graph is an open, pragmatic, AI-first way to make domain knowledge reusable across data, applications and AI systems. Instead of modeling an ontology by hand, an agent drafts one for each use case, grounds every concept in your real data, and revises it as the question changes. The result lives in Corvic Memory as a knowledge graph of typed entities and typed relationships that agents, apps, analytics and GraphRAG all read from.
Most ontologies are built once, by hand, for one purpose, and they go stale the day the business asks a new question. We took a different approach: let agents build the ontology. Below we walk through the model, show three live graphs you can open right now, and explain how to try it on your own data.
Why hand-built ontologies stall
Classic enterprise ontologies try to describe the whole business in one schema. That takes months of modeling workshops, and the output is a single shared vocabulary that fits nobody perfectly. Finance, compliance and support all have a “Customer”, but they mean different things by it, care about different relationships, and measure different things. So teams either fork the schema and copy the data, or they live with a lowest-common-denominator model.
Meanwhile the questions keep moving. A new data source arrives, a regulator asks something new, or a product team wants a metric that the ontology never anticipated. A static ontology turns every one of those into a change request. For AI agents that need precise, current context, that lag is the difference between a grounded answer and a confident guess.
The model: entities, relationships, measures and meaning
The specification is deliberately small. An ontology in Corvic is a typed property graph plus the business meaning an agent needs to use it correctly. Every element is grounded: it points at the records, documents or fields that back it, so nothing in the graph is a free-floating label.
| Element | What it captures | Example from the ISA-95 graph |
|---|---|---|
| Entity type | A kind of thing the use case cares about, with its identifying and descriptive properties. | ProductionOrder, Equipment, MaterialLot, Personnel |
| Relationship type | A typed, directed connection between two entity types. Relationships are first-class: they are what multi-hop questions traverse. | PERF_RAN_ON_EQUIPMENT, QT_TESTS_LOT, LOT_INSTANCE_OF |
| Measure | A quantity defined over entities and relationships, so metrics mean the same thing to every consumer. | Downtime minutes per equipment, quality-test pass rate per lot |
| Business meaning | Plain-language definitions and rules that tell an agent how to interpret a concept in this use case. | “A MaterialLot is a physical instance of a MaterialDefinition” |
| Grounding | The mapping from each concept to the sources that back it, across tables, documents, APIs and more. | Orders from the MES, tests from lab exports, roles from HR data |
Five principles behind the specification
- 1Use-case-specific. Agents draft a purpose-built ontology for each use case, covering entities, relationships, measures and business meaning. You get the model the question needs, not a universal schema.
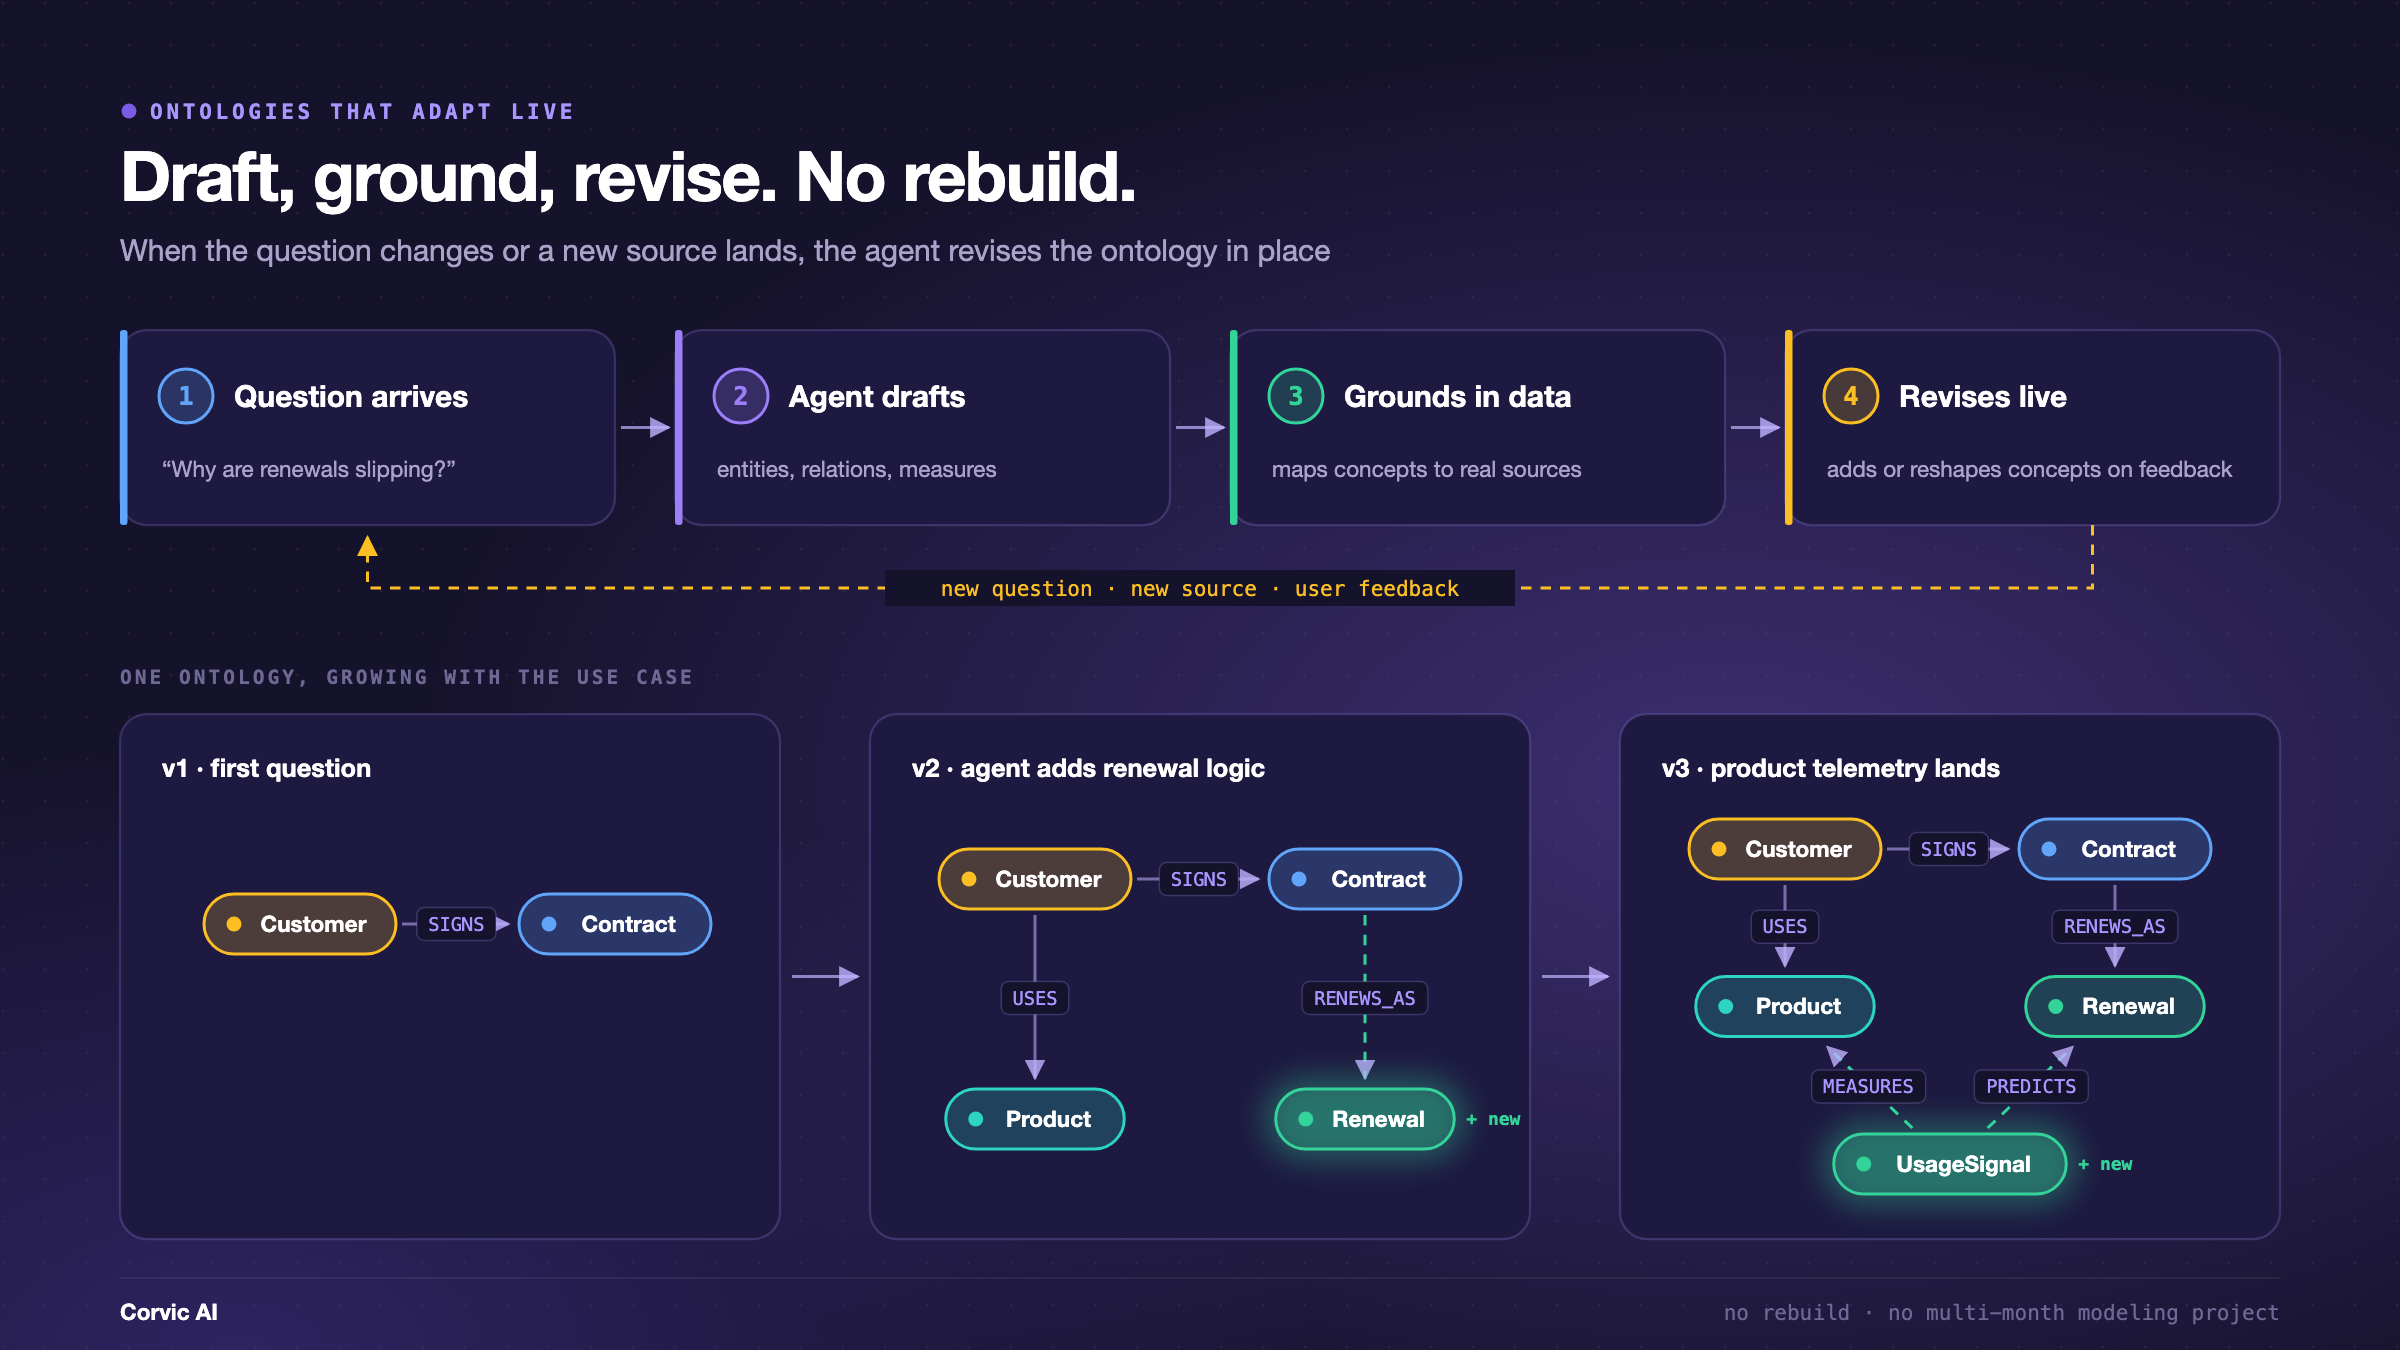
- 2Adapts live. When the question changes or a new source shows up, the agent grounds the new concepts in the data and revises the ontology. There is no rebuild and no multi-month modeling project.
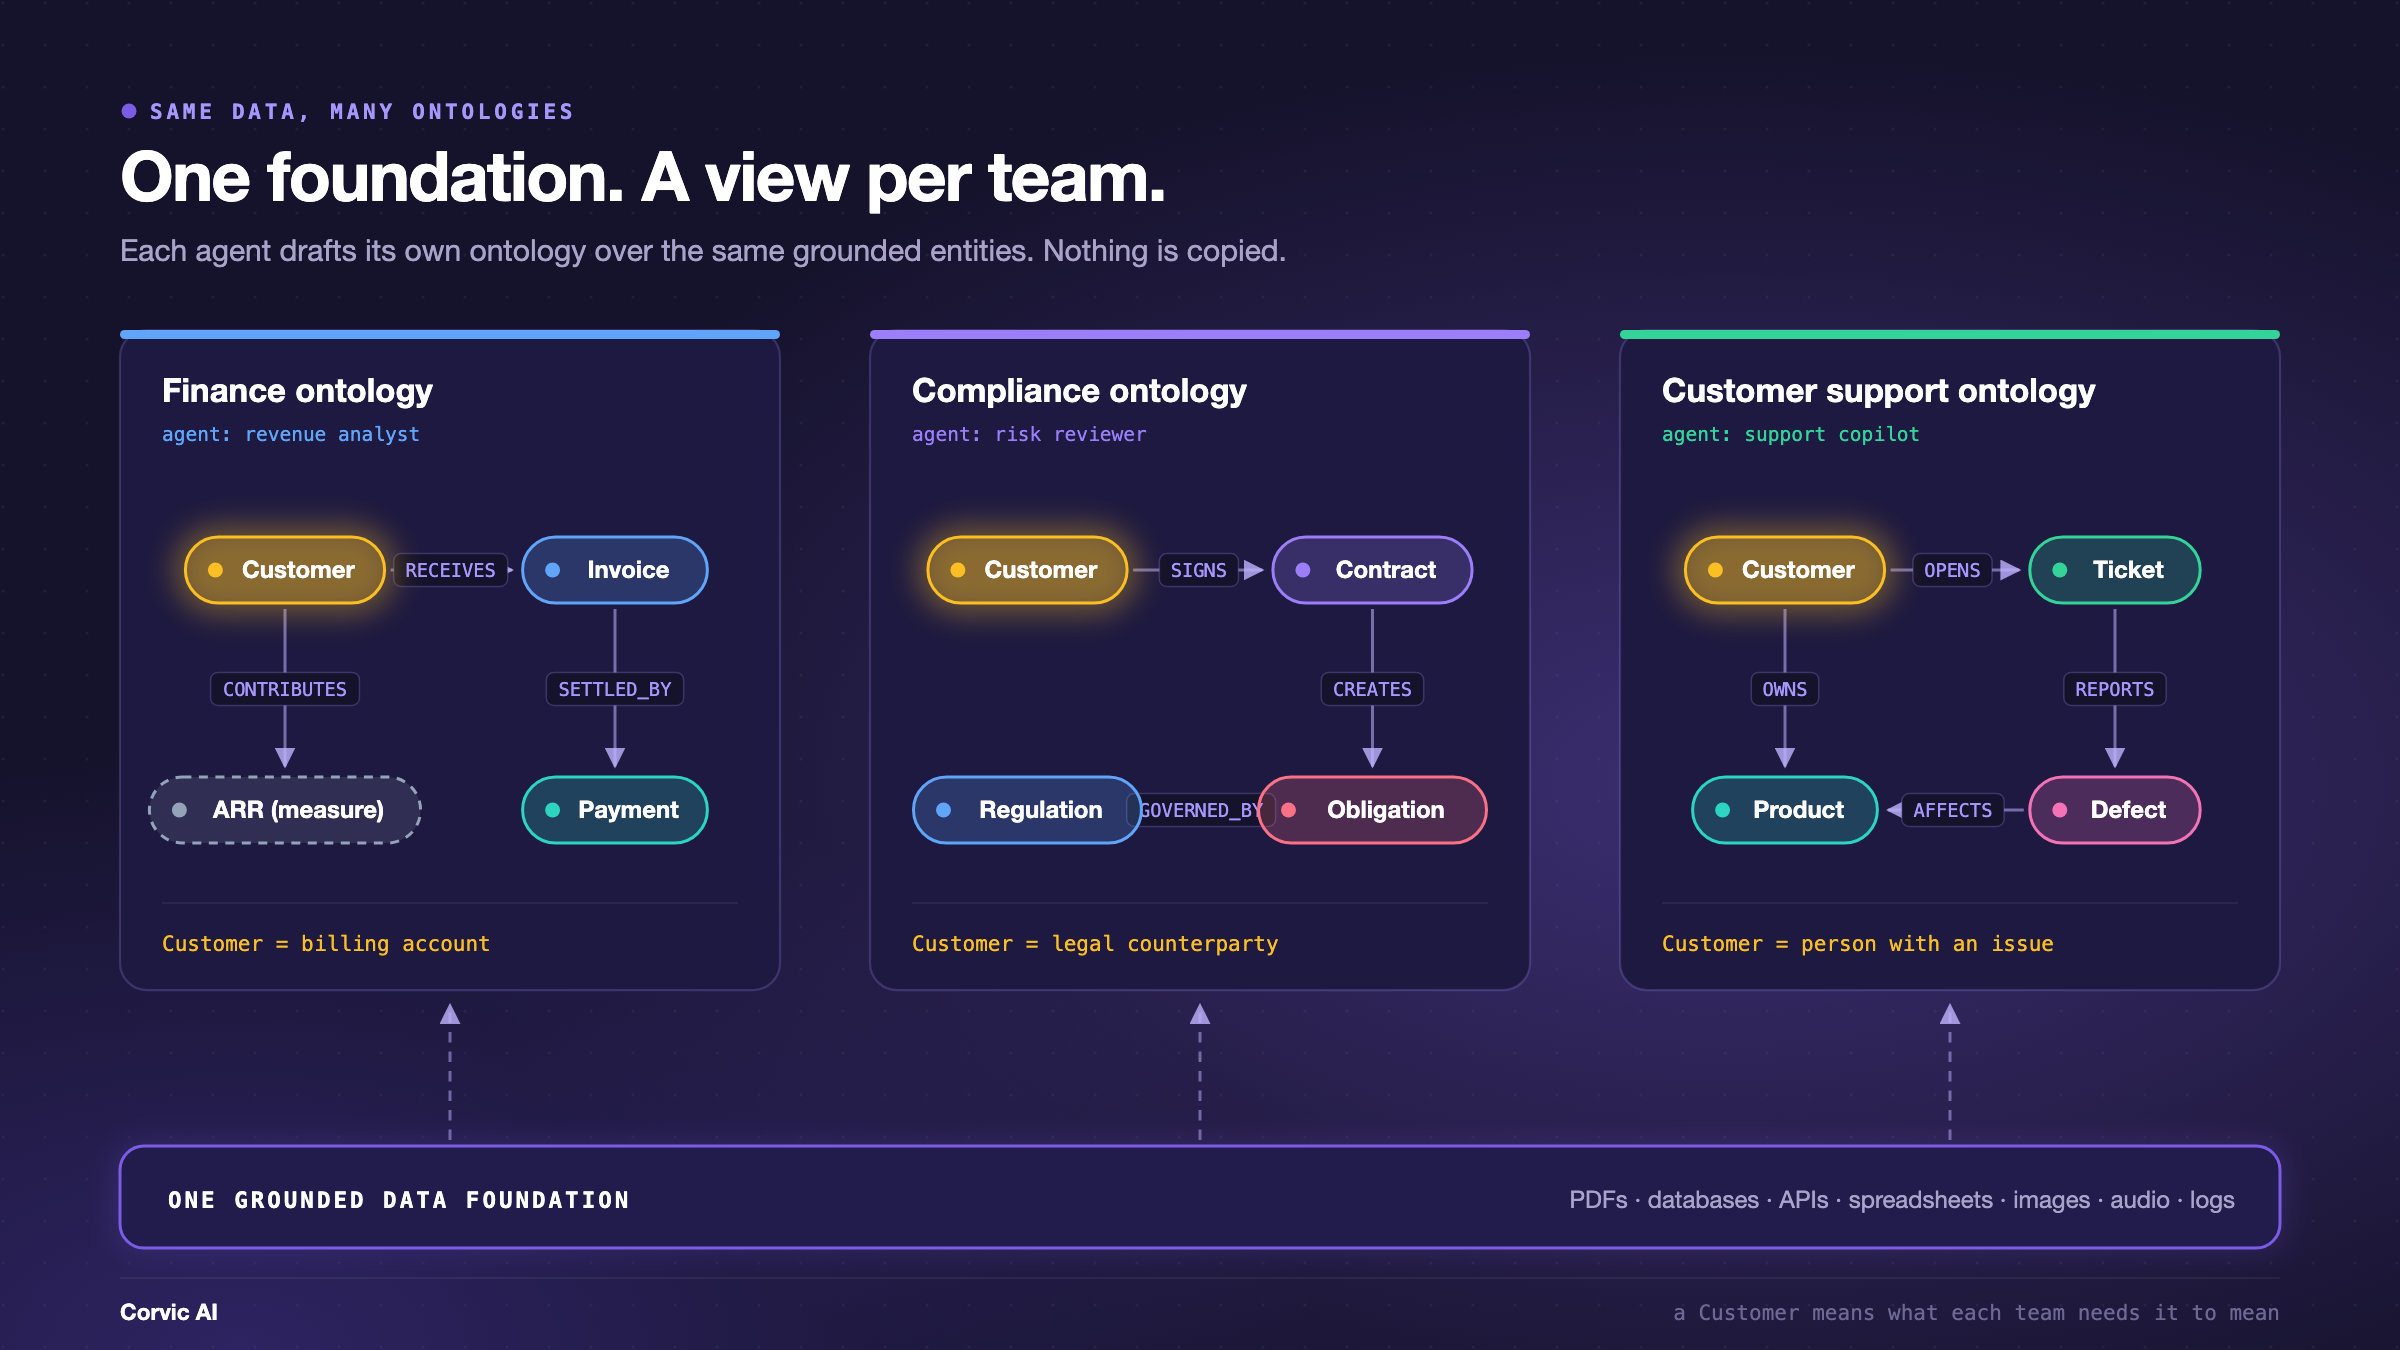
- 3Same data, many ontologies. Finance, compliance and customer support each get their own view over the same underlying data. A “Customer” means what each team needs it to mean, and nothing gets duplicated.
- 4Any source, any form. PDFs, databases, APIs, spreadsheets, images, audio and logs. If it holds knowledge, it can be grounded in the graph.
- 5AI-first. Agents get the context they need to understand and work with your data. Apps, pipelines, analytics and GraphRAG all read from the same graph.
Same data, many ontologies
Because ontologies are views over a single grounded foundation, they are cheap to create and safe to specialize. The finance agent models a Customer as a billing account that receives invoices and contributes to ARR. The compliance agent models the same Customer as a legal counterparty that signs contracts, which create obligations governed by regulation. The support copilot sees a person who owns products and opens tickets about defects.
All three point at the same customer records. There is no second copy to reconcile, and a fix to the underlying data shows up in every view at once.
Ontologies that adapt live
The ontology is a working artifact, not a deliverable. A question arrives (“why are renewals slipping?”), the agent drafts the entities and relationships it needs, grounds them in real sources, and checks what the data actually supports. When a follow-up question or a new source lands, say product telemetry, the agent adds a UsageSignal entity, connects it to Product and Renewal, and the graph keeps serving queries while it grows.
Grounding is what makes this safe. A concept the agent cannot back with data does not become a confident node in the graph; it shows up as a gap you can see and fill.
See it on real data: three live knowledge graphs
These graphs were built by Corvic agents and are shared publicly. Open any of them to explore the entities and relationships, click an edge to see what it connects, and ask the graph to find clusters, hubs and bridges, analogies, or things that look wrong.
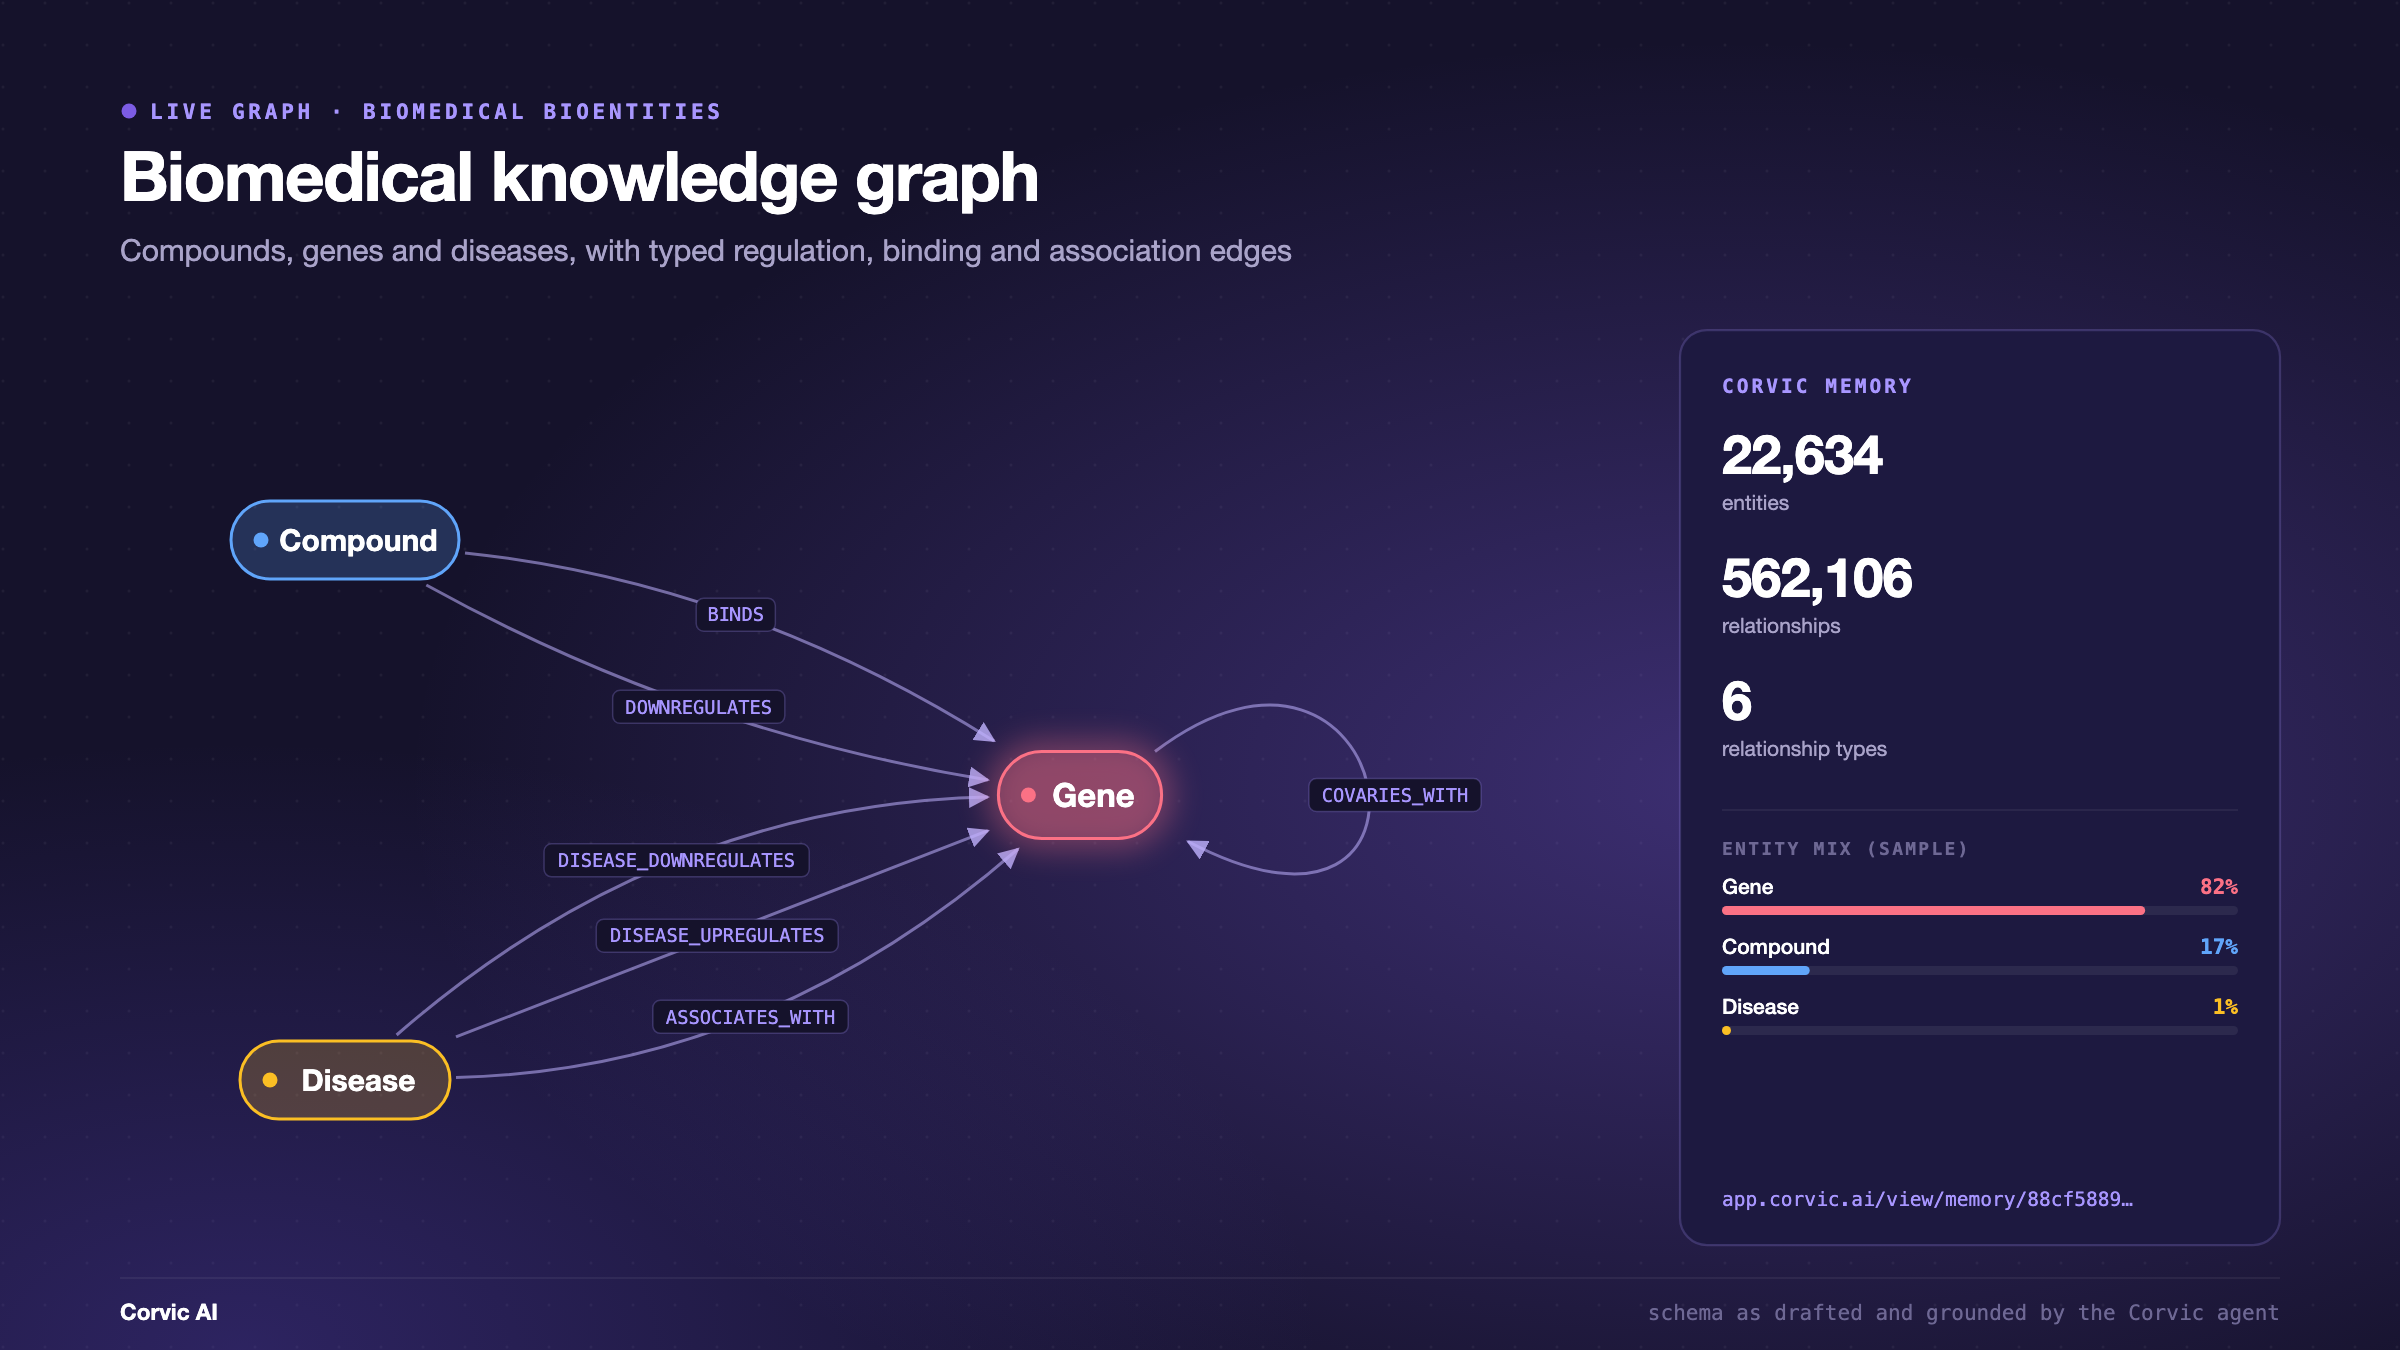
Biomedical: relationships carry the science
In the biomedical graph, the interesting knowledge is almost entirely in the edges. Six relationship types (BINDS, DOWNREGULATES, COVARIES_WITH, ASSOCIATES_WITH, DISEASE_UPREGULATES and DISEASE_DOWNREGULATES) connect three entity types. A question like “which approved compounds push expression in the opposite direction to this disease?” is a two-hop traversal: Disease → DISEASE_UPREGULATES → Gene ← DOWNREGULATES ← Compound. Flat vector retrieval cannot express that join; the graph answers it directly.
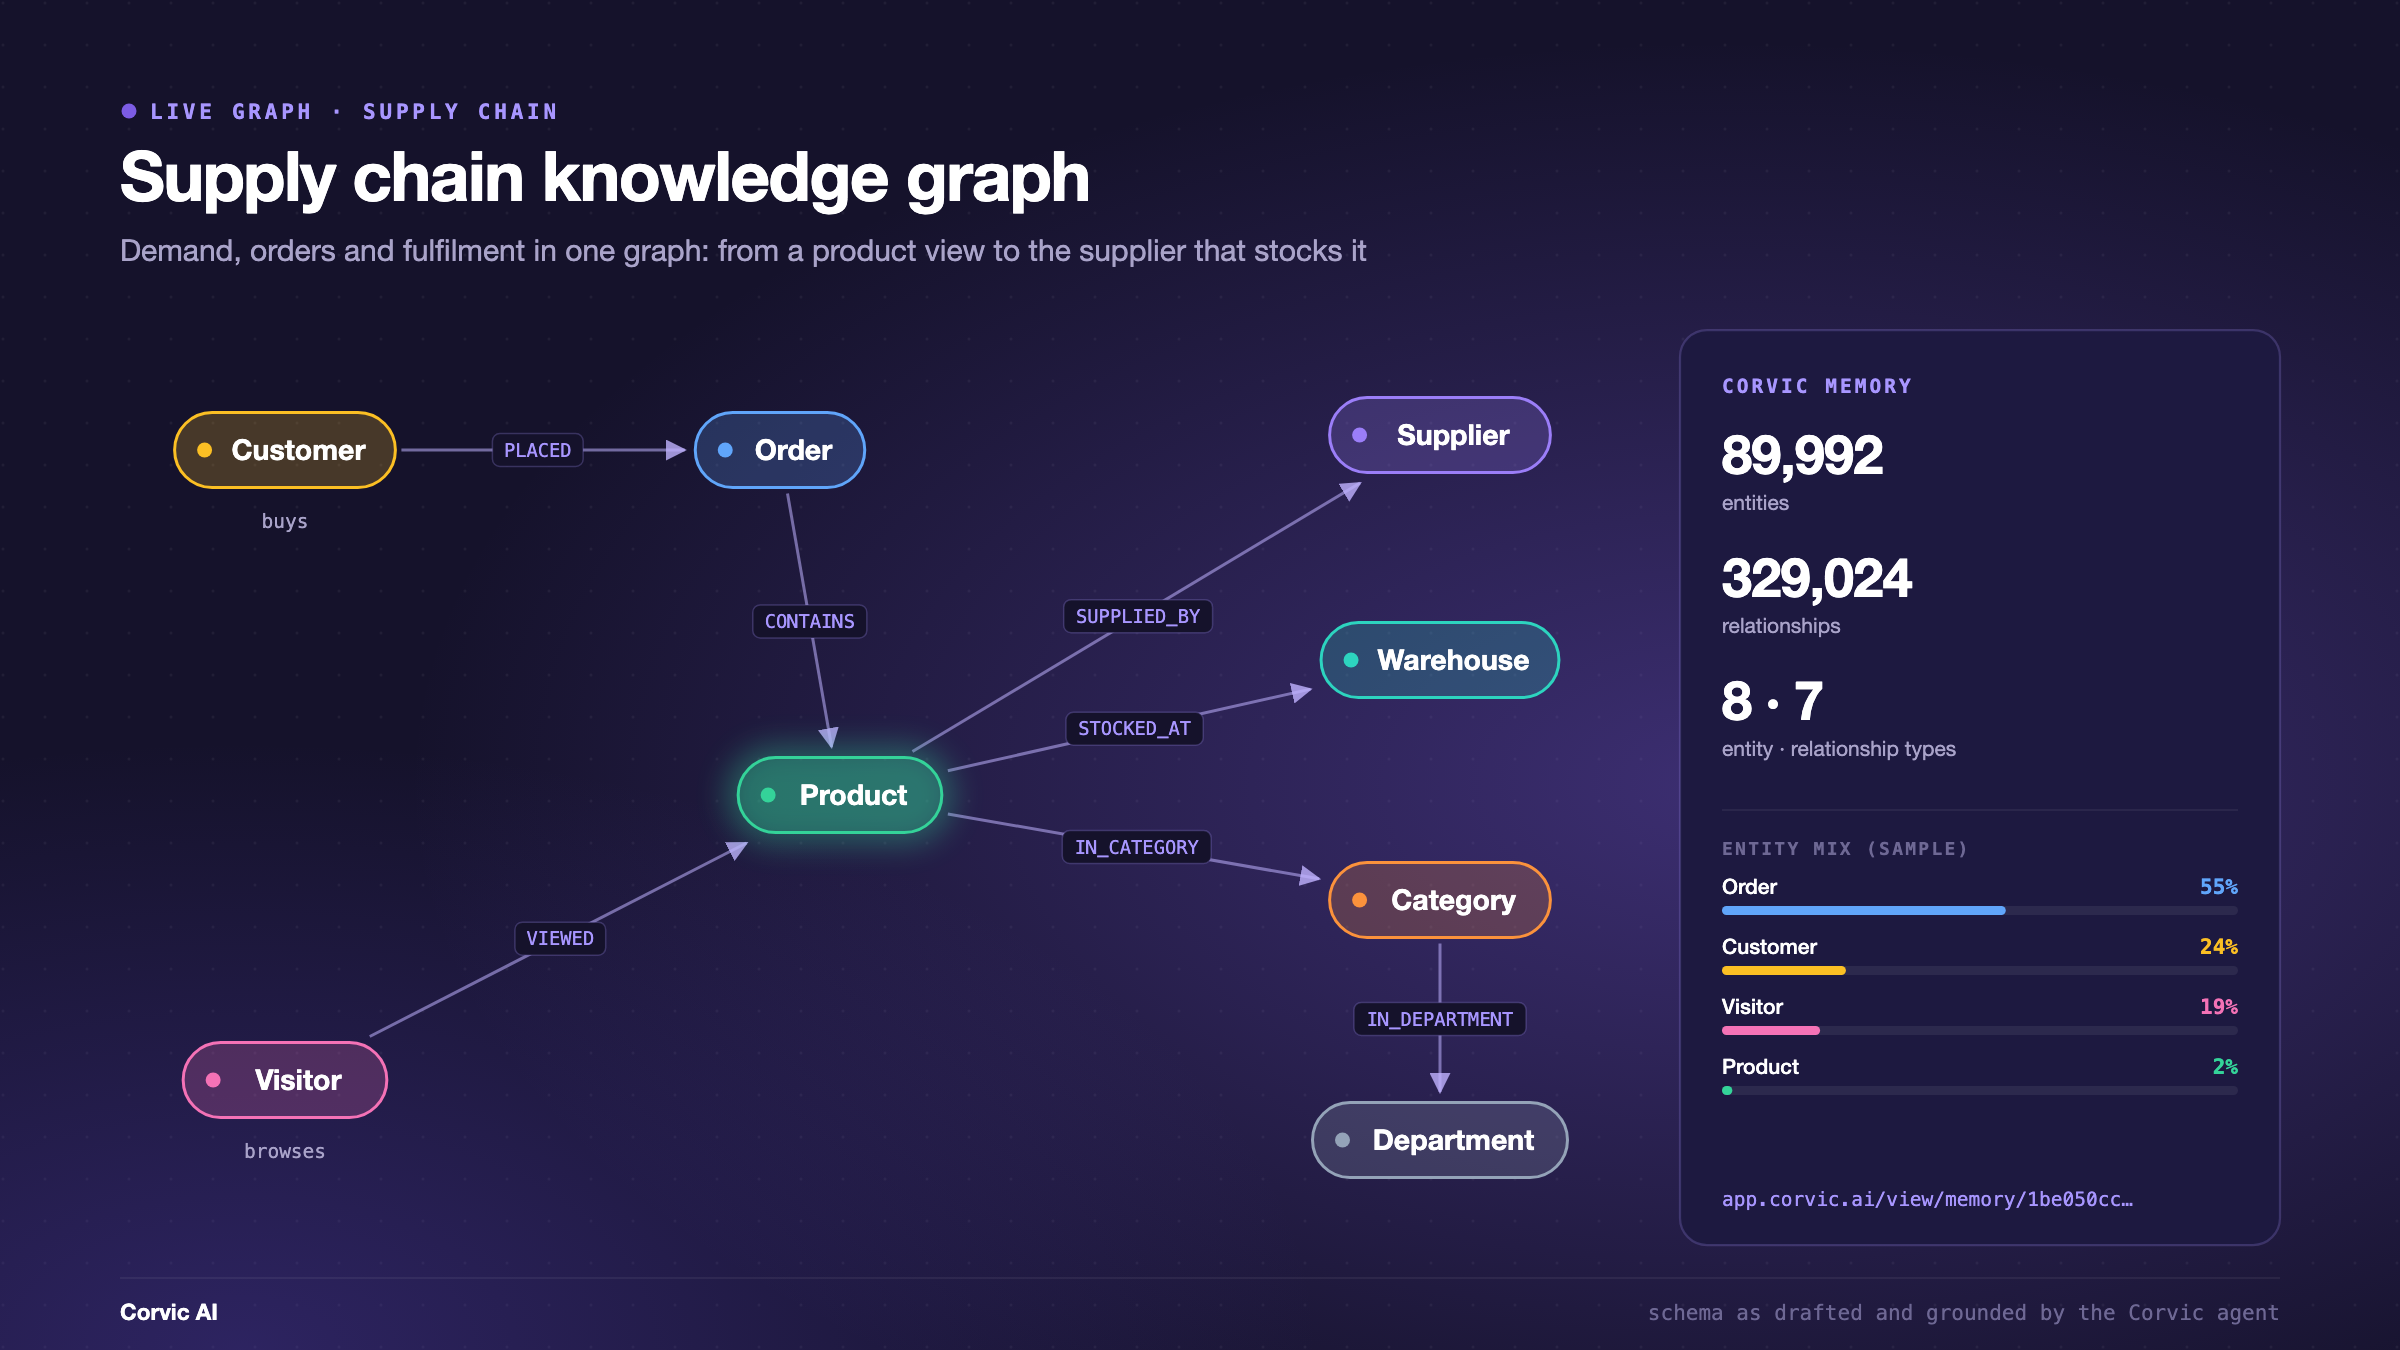
Supply chain: from a click to a supplier
The supply chain graph joins behavioral data (Visitor VIEWED Product), transactional data (Customer PLACED Order, Order CONTAINS Product) and operational data (Product SUPPLIED_BY Supplier, STOCKED_AT Warehouse, IN_CATEGORY Category, IN_DEPARTMENT Department). Questions that normally need three systems and a data engineer, such as “which suppliers sit behind the products with the most views but the fewest orders?”, become a single path through one graph.
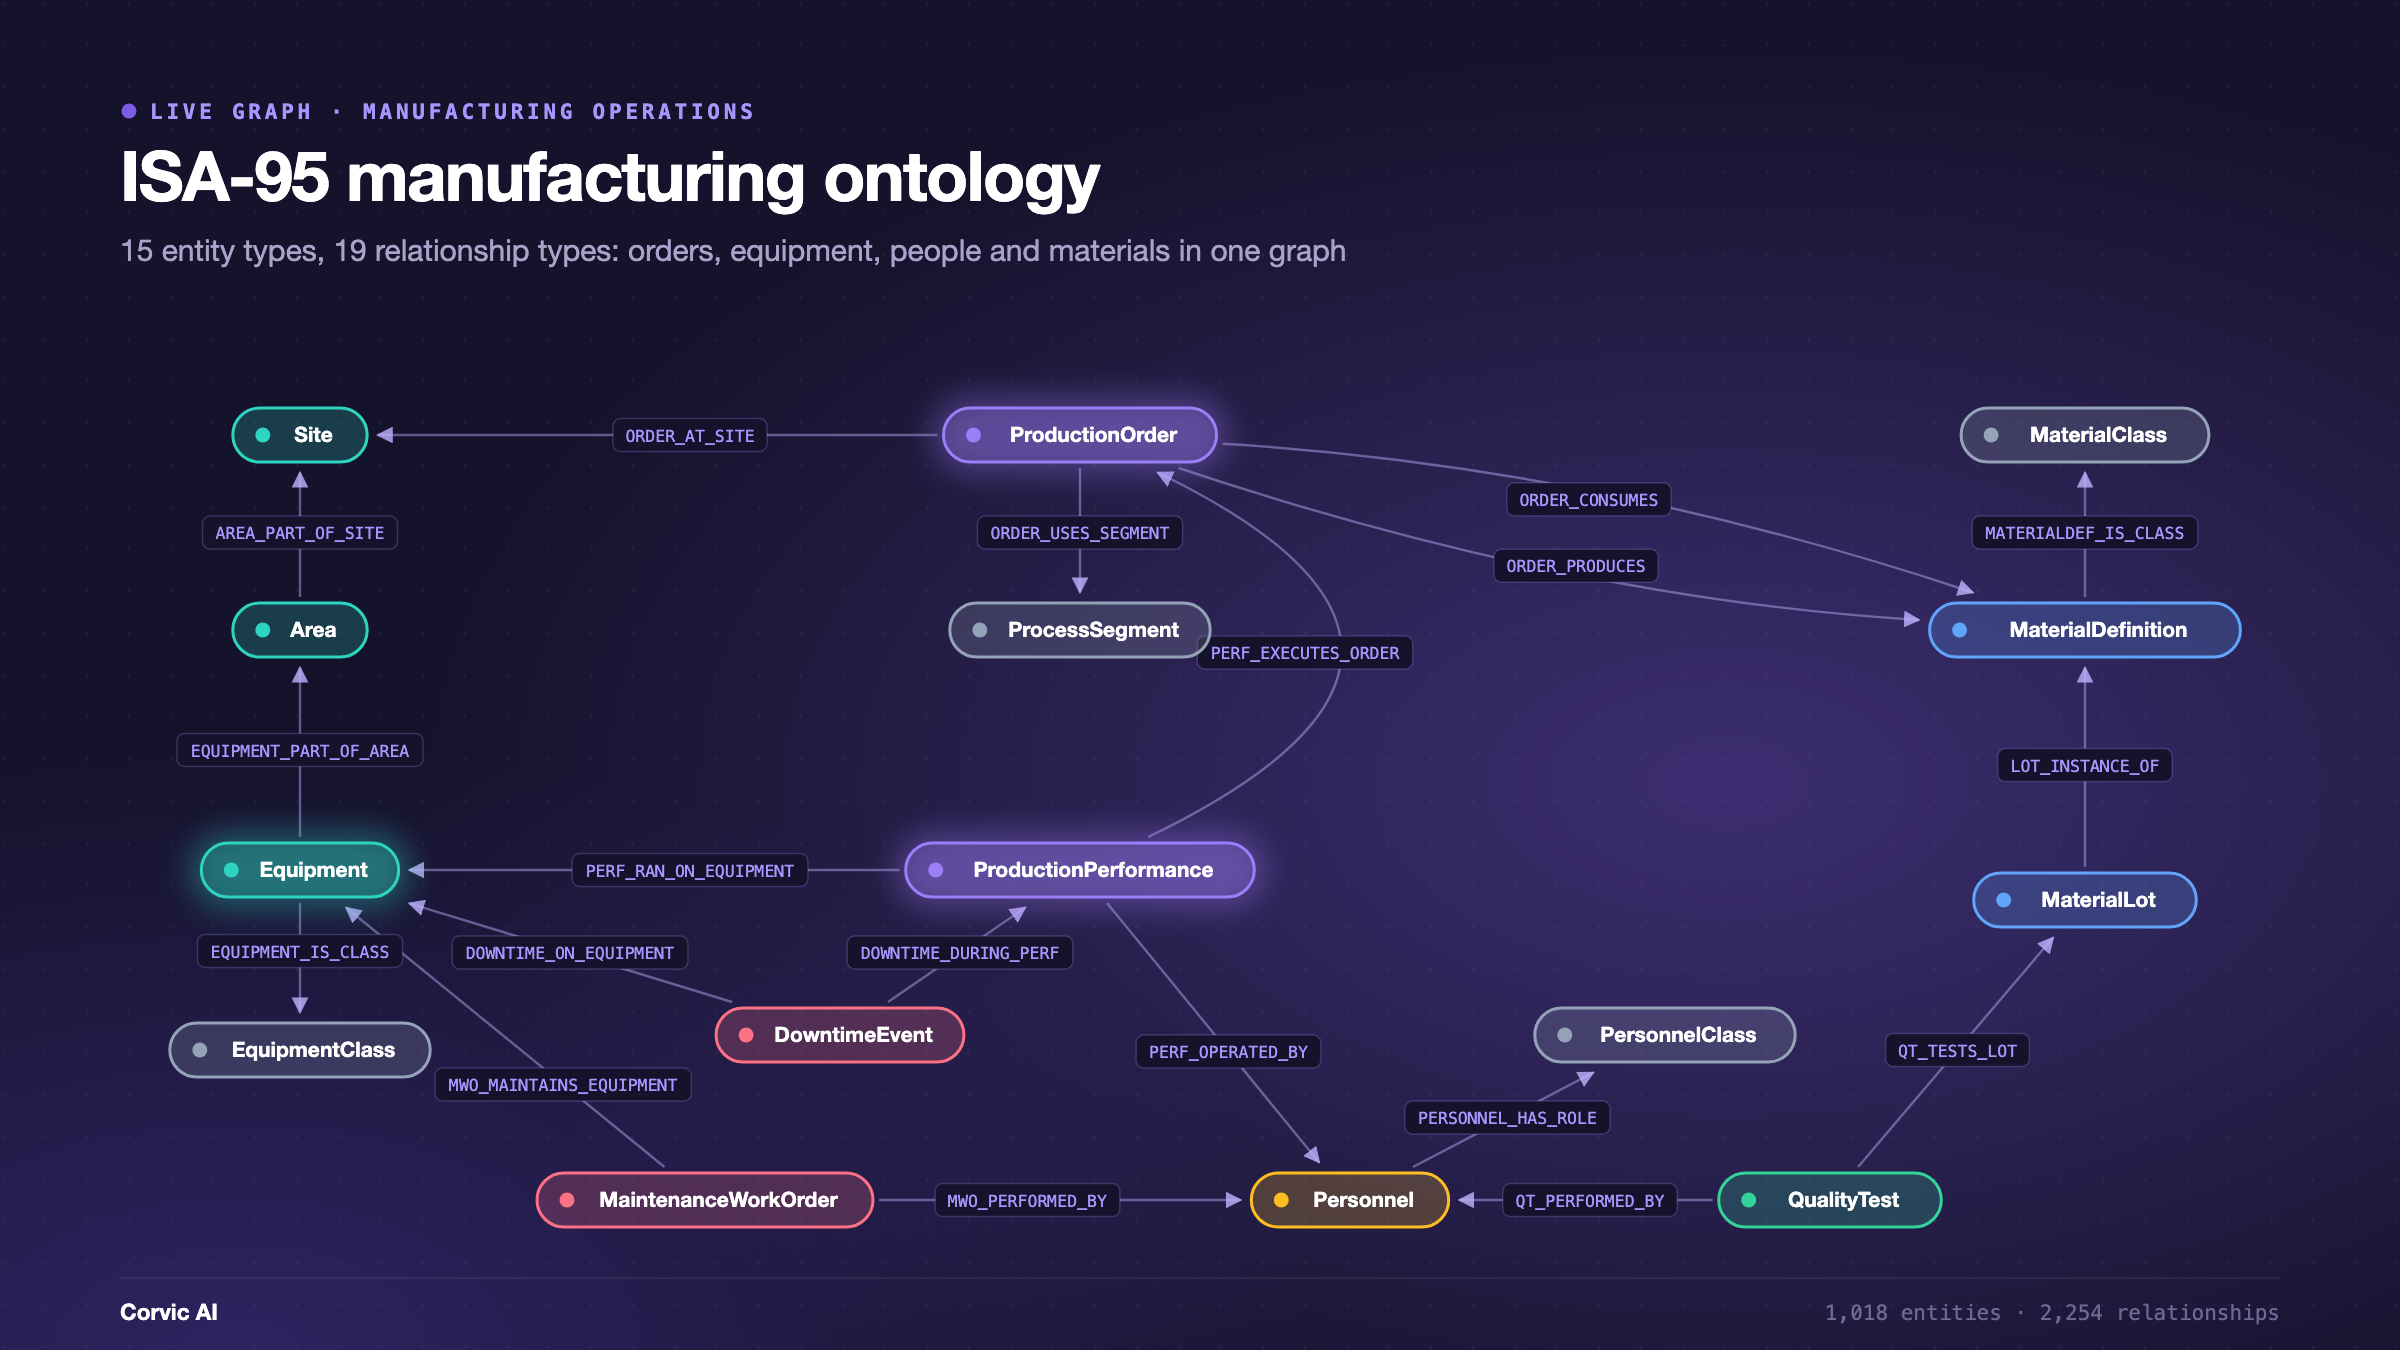
Manufacturing: a standard, grounded by an agent
The ISA-95 graph shows that agent-built does not mean ad hoc. The agent followed the ISA-95 operations model and grounded it in plant data: equipment rolls up to areas and sites; production performance executes an order, runs on equipment and is operated by personnel; downtime events attach to both the equipment and the run they interrupted; quality tests are performed by people on specific material lots, which are instances of material definitions. Root-cause questions like “which operators and machines are common to the lots that failed testing last week?” follow those typed edges instead of hand-written joins.
One graph for agents, apps, analytics and GraphRAG
Once the ontology exists, every consumer reads the same typed graph:
- AI agents get the entity and relationship types, their meaning, and the grounded records behind them as context, so they can plan multi-step work without guessing at your schema.
- GraphRAG and search retrieve along relationships, which is what multi-hop questions need, instead of hoping the right chunks land near each other in vector space.
- Analytics and BI compute measures defined once in the ontology, so a metric means the same thing on a dashboard as it does in an agent’s answer.
- Apps and pipelines build on stable, typed entities rather than raw tables, and keep working as the ontology grows.
One data foundation. Many ontologies. Knowledge that evolves with the use case. Domain knowledge should not be locked in one schema, one tool or one team’s head. It should be open, reusable and ready for agents.
Point Corvic at your documents, databases or APIs, describe the question you want answered, and watch an agent draft and ground the ontology in Corvic Memory. Start with one of the live graphs above, or bring your own data.